
Pretty much from the start of the project, Suricata has been able to track flows. In Suricata the term ‘flow’ means the bidirectional flow of packets with the same 5 tuple. Or 7 tuple when vlan tags are counted as well.
Such a flow is created when the first packet comes in and is stored in the flow hash. Each new packet does a hash look-up and attaches the flow to the packet. Through the packet’s flow reference we can access all that is stored in the flow: TCP session, flowbits, app layer state data, protocol info, etc.
When a flow hasn’t seen any packets in a while, a separate thread times it out. This ‘Flow Manager’ thread constantly walks the hash table and looks for flows that are timed out. The time a flow is considered ‘active’ depends on the protocol, it’s state and the configuration settings.
In Suricata 2.1, flows will optionally be logged when they time out. This logging is available through a new API, with an implementation for ‘Eve’ JSON output already developed. Actually, 2 implementations:
- flow — logs bidirectional records
- netflow — logs unidirectional records
As the flow logging had to be done at flow timeout, the Flow Manager had to drive it. Suricata 2.0 and earlier had a single Flow Manager thread. This was hard coded, and in some cases it was clearly a bottleneck. It wasn’t uncommon to see this thread using more CPU than the packet workers.
So adding more tasks to the Flow Manager, especially something as expensive as output, was likely going to make things worse. To address this, 2 things are now done:
- multiple flow manager support
- offloading of part of the flow managers tasks to a new class of management threads
The multiple flow managers simply divide up the hash table. Each thread manages it’s own part of it. The new class of threads is called ‘Flow Recycler’. It takes care of the actual flow cleanup and recycling. This means it’s taking over a part of the old Flow Manager’s tasks. In addition, if enabled, these threads are tasked with performing the actual flow logging.
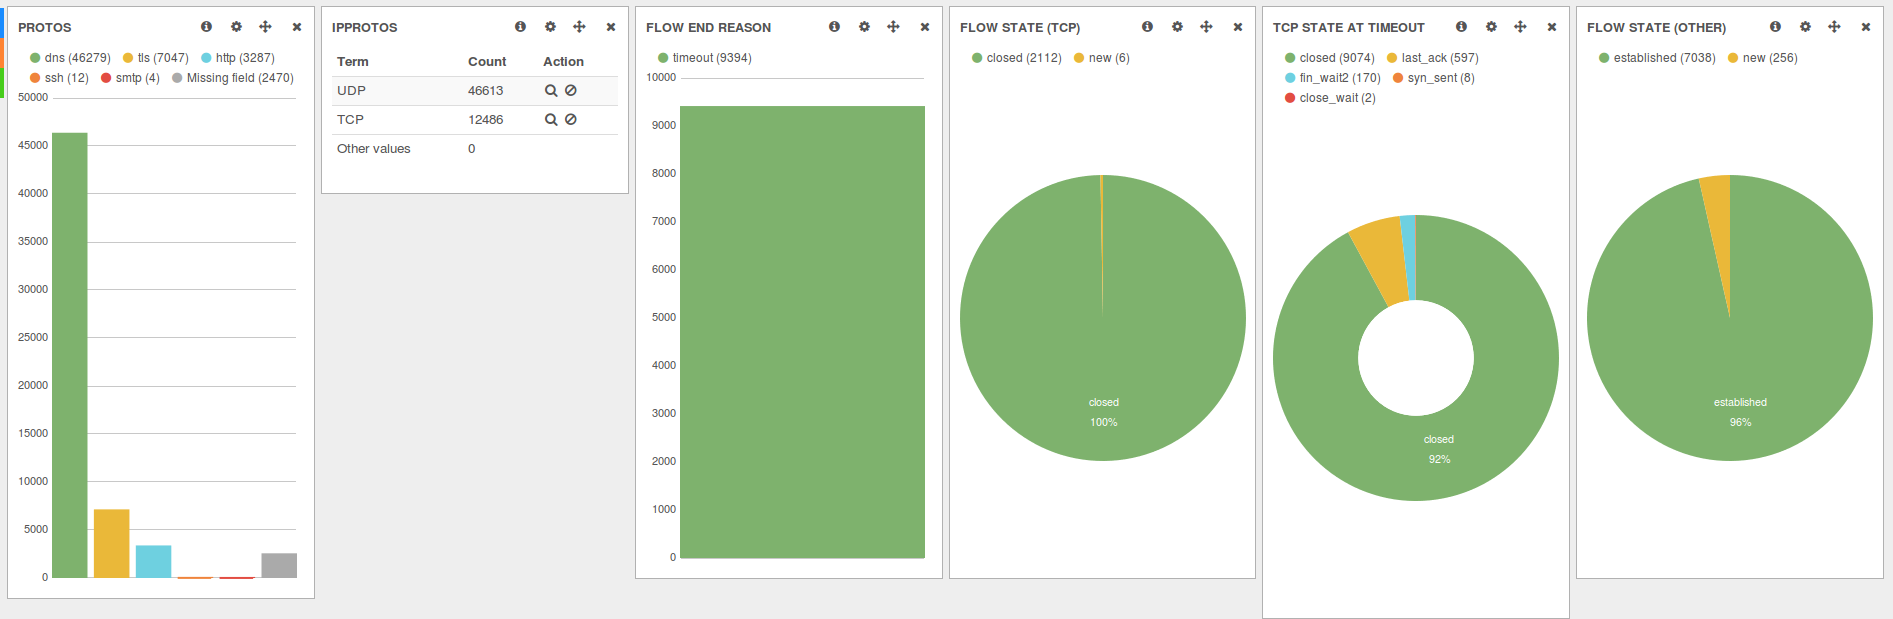
As the flow logging follows the ‘eve’ format, passing it into Elasticsearch, Logstash and Kibana (ELK) is trivial. If you already run such a setup, the only thing that is need is enabling the feature in your suricata.yaml.
 The black netflow dashboard is available here: http://www.inliniac.net/files/NetFlow.json
Many thanks to the FireEye Forensics Group (formerly nPulse Technologies) for funding this work.

Mind if I include this in https://github.com/markwalkom/kibana-dashboards?
Sure, go ahead!
Hi
When you say : “If you already run such a setup, the only thing that is need is enabling the feature in your suricata.yaml”, what are the keywords you can use in suricata.yaml to do that ?
I can’t find them (I don’t have any “netflow.bytes” in logstash/kibana with my eve.json)
Kind regards
Hi
I didn’t find the options in suricata.yaml for flow logging…
What did you use to have the kibana Dashboard : http://www.inliniac.net/files/NetFlow.json ?
kind regards
Under your ‘eve’ config, add ‘netflow’. E.g.:
outputs: # "United" event log in JSON format - eve-log: enabled: yes type: file #file|syslog|unix_dgram|unix_stream filename: eve.json # the following are valid when type: syslog above #identity: "suricata" #facility: local5 #level: Info ## possible levels: Emergency, Alert, Critical, ## Error, Warning, Notice, Info, Debug append: no types: - alert: payload: true - http: extended: yes # enable this for extended logging information custom: [Accept-Encoding, Accept-Language, Authorization, Server, Via] # - dns - tls: extended: yes # enable this for extended logging information - files: force-magic: yes # force logging magic on all logged files force-md5: yes # force logging of md5 checksums - drop - ssh - flow - netflowit works!
thanks a lot (that was simple :p)
Kind regards
Hi,
I am a new Suricata user, I had some experiences of using Snort, what I really want to do is adding some new rules in the Suricata rule base. I hope Suricata can filter the packets that match my defined rule. I have tried
sudo suricata -c suricata.yaml -r test -s /etc/suricata/rules/dns-events.rules -l /var/log/suricata/
But, it gives all packets in my trace file.
I just wonder, is there anything special settings I have to configure for Suricate only output the pcap-log that contains all reverse lookup packets?
Many thanks for your attention to this matter. Have a nice day.
Kind regards,
Steven
The pcap-log is unconditional. It just logs all packets.
Hi,
Wanted to understand if a flow id could be same as a single TCP session? While tracking I found multiple sessions. I could see multiple source IP’s doing HTTP requests for a single flow_id. Is this because I’m capturing from mirror port?
Currently the flow id is not very unique, so you may see the same flow id in different flows separated by some time. I’d suggest using it together with the 5 tuple.
Awesome functionality. Thanks a ton for making this available.
Any suggestions for how to filter traffic generated by my suricata host from flow logging? I’m using fluentd to send my eve.json log to a third party host so every log message sent generates another log message creating a bit of a loop.
I added a filter to the bpf line in the .yaml file (bpf-filter: not src host 192.168.1.20), which worked but I would prefer not to hard code it to an IP address. Is there a variable that I can use that suricata will recognize as any IP address on the local host?
Thanks!
I think currently a BPF like you have is the only solution.