
Pretty much from the start of the project, Suricata has been able to track flows. In Suricata the term ‘flow’ means the bidirectional flow of packets with the same 5 tuple. Or 7 tuple when vlan tags are counted as well.
Such a flow is created when the first packet comes in and is stored in the flow hash. Each new packet does a hash look-up and attaches the flow to the packet. Through the packet’s flow reference we can access all that is stored in the flow: TCP session, flowbits, app layer state data, protocol info, etc.
When a flow hasn’t seen any packets in a while, a separate thread times it out. This ‘Flow Manager’ thread constantly walks the hash table and looks for flows that are timed out. The time a flow is considered ‘active’ depends on the protocol, it’s state and the configuration settings.
In Suricata 2.1, flows will optionally be logged when they time out. This logging is available through a new API, with an implementation for ‘Eve’ JSON output already developed. Actually, 2 implementations:
- flow — logs bidirectional records
- netflow — logs unidirectional records
As the flow logging had to be done at flow timeout, the Flow Manager had to drive it. Suricata 2.0 and earlier had a single Flow Manager thread. This was hard coded, and in some cases it was clearly a bottleneck. It wasn’t uncommon to see this thread using more CPU than the packet workers.
So adding more tasks to the Flow Manager, especially something as expensive as output, was likely going to make things worse. To address this, 2 things are now done:
- multiple flow manager support
- offloading of part of the flow managers tasks to a new class of management threads
The multiple flow managers simply divide up the hash table. Each thread manages it’s own part of it. The new class of threads is called ‘Flow Recycler’. It takes care of the actual flow cleanup and recycling. This means it’s taking over a part of the old Flow Manager’s tasks. In addition, if enabled, these threads are tasked with performing the actual flow logging.
As the flow logging follows the ‘eve’ format, passing it into Elasticsearch, Logstash and Kibana (ELK) is trivial. If you already run such a setup, the only thing that is need is enabling the feature in your suricata.yaml.
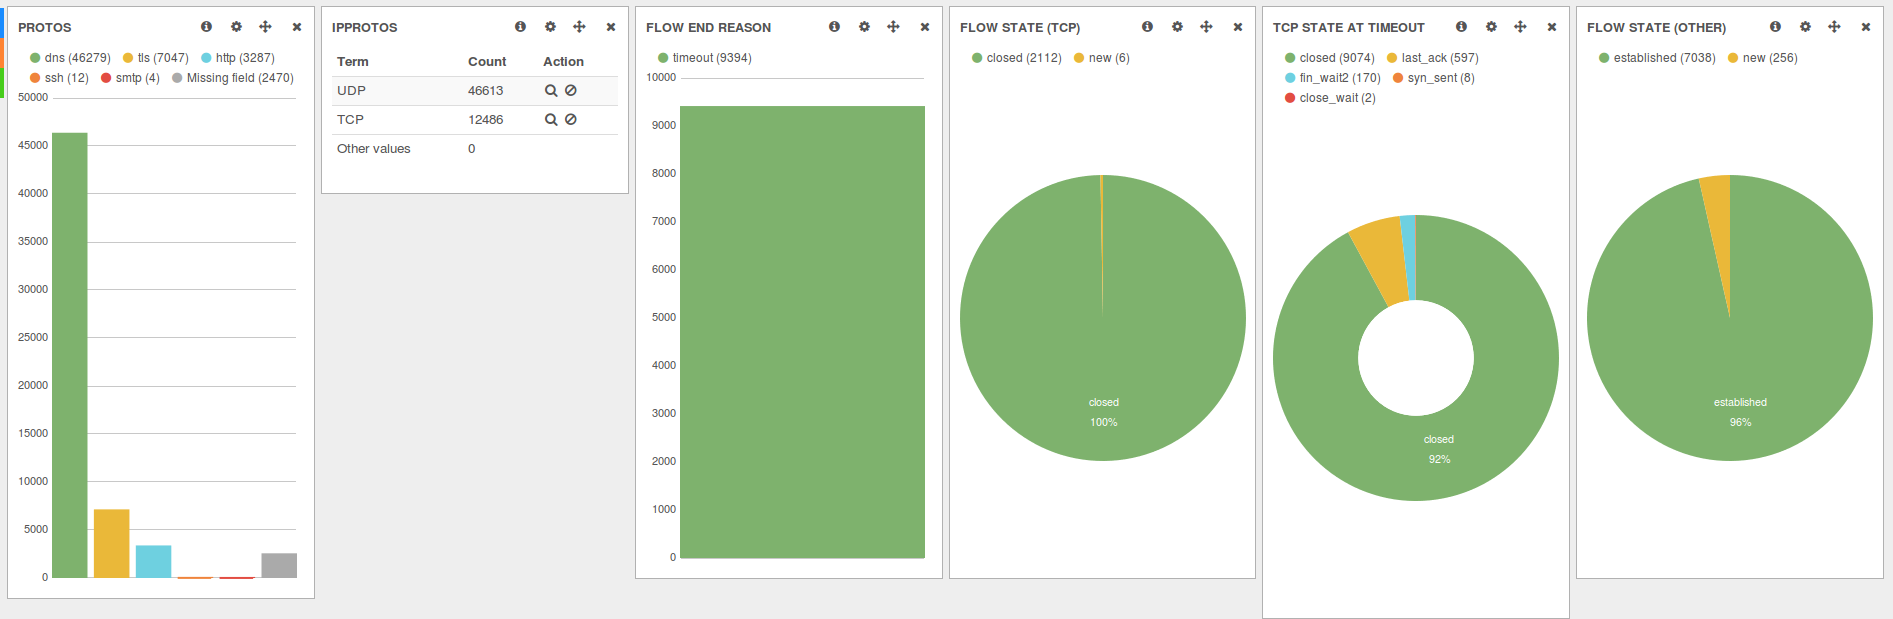
 The black netflow dashboard is available here: http://www.inliniac.net/files/NetFlow.json
Many thanks to the FireEye Forensics Group (formerly nPulse Technologies) for funding this work.

You must be logged in to post a comment.