Suricata 2.0 and beyond

Today I finally released Suricata 2.0. The 2.0 branch opened in December 2012. In the little over a year that it’s development lasted, we have closed 183 tickets. We made 1174 commits, with the following stats:

582 files changed, 94782 insertions(+), 63243 deletions(-)

So, a significant update! In total, 17 different people made commits. I’m really happy with how much code and features were contributed. When starting Suricata this was what I really hoped for, and it seems to be working!

Eve

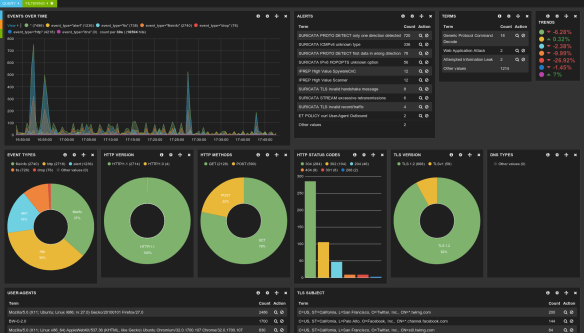
The feature I’m most excited about is ‘Eve’. It’s the nickname of a new logging output module ‘Extendible Event Format’. It’s an all JSON event stream that is very easy to parse using 3rd party tools. The heavy lifting has been done by Tom Decanio. Combined with Logstash, Elasticsearch and Kibana, this allows for really easy graphical dashboard creation. This is a nice addition to the existing tools which are generally more alert centered.

kibana300 kibana300map kibana-suri

Splunk support is easy as well, as Eric Leblond has shown:

regit-Screenshot-from-2014-03-05-231712

Looking forward

While doing releases is important and somewhat nice too, the developer in me is always glad when they are over. Leading up to a release there is a slow down of development, when most time is spent on fixing release critical bugs and doing some polishing. This slow down is a necessary evil, but I’m glad when we can start merging bigger changes again.

In the short term, I shooting for a fairly quick 2.0.1 release. There are some known issues that will be addressed in that.

More interestingly from a development perspective is the opening of the 2.1 branch. I’ll likely open that in a few weeks. There are a number of features in progress for 2.1. I’m working on speeding up pcap recording, which is currently quite inefficient. More interestingly, Lua output scripting. A preview of this work is available here  with some example scripts here.

Others are working on nice things as well: improving protocol support for detection and logging, nflog and netmap support, taxii/stix integration, extending our TLS support and more.

I’m hoping the 2.1 cycle will be shorter than the last, but we’ll see how it goes 🙂

Closing in on Suricata 1.4

I just made Suricata 1.4rc1 available with some pretty exciting features: unix socket mode and IP reputation.

Unix socket

First of all, Eric Leblond’s work on the Unix socket was merged. The unix socket work consists of two parts. The unix socket protocol implementation and a new runmode.

The protocol implementation is based on JSON messages over unix socket. Eric will be fully documenting it soon. Currently the commands are limited to shutting down and getting some basic stats. This part isn’t very exciting yet, but the groundwork for many future extensions has been laid.

The part that is exciting right now, is the unix socket runmode. That this does is start Suricata with all the rules and such, and then it waits for commands on the unix socket. Then the commands will be a pcap filename – log directory pair. This pcap will then be inspected against the rules and the logs go into the log directory supplied. As this can be easily scripted (a python script is provided), it’s a very fast way to test your pcap collections, as the overhead of starting and stopping is skipped.

This may initialy appeal mostly for those of you doing sandnetting and malware analysis, where tens of thousands of pcaps and automatically processed every hour or day, I think this could grow into a feature for a wider audience as well. For example, I could see use in Sguil or Snorby, or pretty much every event manager with full packet capture support, adding an option to scan a pcap associated with an event again. Maybe against _all_ rules, instead of the tuned set running on the live sensors. Maybe you can re-inspect old sessions against the current rules this way to find hits on attacks that were 0-days at the time, etc.

I think there could be many possibilities.

IP Reputation

A slightly more polished version of the code I discussed here is now available in this release. It’s one of those things where it will be very interesting to see how people will put it to use.

Matt Jonkman just wrote some of his ideas to the Emerging Threats mailing list: one of the ideas Matt wrote about is to amend weak rules with reputation data. So if you have a signature that is phrone to false positives, you probably disable it currently. But what if you combine it with reputation data? If the weak rule fires on a sketchy ip, it may be a more reliable alert.

We’ll see how this plays out.

1.4 final

We’re hoping that if nothing big happens, we can do a mid-December 1.4 final release. So please consider running this new release. It’s running very stable on quite a number of places, ISP networks, Lab networks, home networks, sandnetting networks, etc. But we need much more testing to find issues and/or gain confidence that we have found the most important issues. Thanks for helping out!

Listening on multiple interfaces with Suricata

A question I see quite often is, can I listen on multiple interfaces with a single Suricata instance? Until now the answer always was “no”. I’d suggest trying the “any”-pseudo interface (suricata -i any), with an bpf to limit the traffic or using multiple instances of Suricata. That last suggestion was especially painful, as one of the goals of Suricata is to allow a single process to process all packets using all available resources.

Last week I found some time to look at how hard adding support for acquiring packets from multiple interfaces would be. Turned out, not so hard! Due to Suricata’s highly modular threading design, it was actually quite easy. I decided to keep it simple, so if you want to add multiple interfaces to listen on, just add each separately on the command line, like so: suricata -i eth0 -i eth1 -i ppp0. This will create a so called “receive thread” for each of those interfaces.

I’ve added no internal limits, so in theory it should possible to add dozens. I just tested with 2 though, so be careful. Normally the thread name in logs and “top” for the pcap receive thread is “ReceivePcap”. This is still true if a single interface is passed to Suricata. In case more are passed to Suricata, thread names change to “RecvPcap-<int>”, e.g. RecvPcap-eth0 and RecvPcap-eth1. Untested, but it should work fine to monitor multiple interfaces from different types. Suricata sets the data link type in the interface-specific receive thread.

If you’re interested in trying out this new feature, there are a few limitations to consider. First, no Windows support yet. I hope this can be addressed later. Second, the case where two or more interfaces (partly) see the same traffic is untested. The problem here is that we’ll see identical packets going into the engine. This may (or may not, like I said, it’s untested) screw up the defrag, stream engines. Might cause duplicate alerts, etc. Addressing this is something that would probably require keeping a hash of packets so we can detect duplicates. This is probably quite computationally intensive, so it may not be worth it. I’m very much open to other solutions. Patches are even more welcome 🙂

So, for now use it only if interfaces see completely separate traffic. Unless you’re interested to see what happens if you ignore my warnings, in that case I’d like to know! The code is available right now in our current git master, and will be part of 1.1beta2.

Merry xmas everyone!