Suricata has been added to Debian Backports

Thanks to the hard work of Arturo Borrero Gonzalez, Suricata has just been added to the openlogo-100Debian ‘backports’ repository. This allows users of Debian stable to run up to date versions of Suricata.

The ‘Backports’ repository makes the Suricata and libhtp packages from Debian Testing available to ‘stable’ users. As ‘testing’ is currently in a freeze, it may take a bit of time before 2.0.5 and libhtp 0.5.16 appear.

Anyway, here is how to use it.

Install

First add backports repo to your sources:

# echo "deb http://http.debian.net/debian wheezy-backports main" > /etc/apt/sources.list.d/backports.list
# apt-get update

As explained here http://backports.debian.org/Instructions/, this will not affect your normal packages.

To prove this, check:

# apt-get install suricata -s
Conf libhtp1 (0.2.6-2 Debian:7.7/stable [amd64])
Conf suricata (1.2.1-2 Debian:7.7/stable [amd64])

Not what we want, as that is still the old version.

To install Suricata from backports, we need to specify the repo:

# apt-get install -t wheezy-backports suricata -s
Conf libhtp1 (0.5.15-1~bpo70+1 Debian Backports:/wheezy-backports [amd64])
Conf suricata (2.0.4-1~bpo70+1 Debian Backports:/wheezy-backports [amd64])

Let’s do it!

# apt-get install -t wheezy-backports suricata
...
Setting up suricata (2.0.4-1~bpo70+1) ...
[FAIL] suricata disabled, please adjust the configuration to your needs ... failed!
[FAIL] and then set RUN to 'yes' in /etc/default/suricata to enable it. ... failed!

Suricata 2.0.4 is now installed, but it’s not yet running.
To see what features have been compiled in, run:

# suricata --build-info
This is Suricata version 2.0.4 RELEASE

Suricata Configuration:
  AF_PACKET support:                       yes
  PF_RING support:                         no
  NFQueue support:                         yes
  NFLOG support:                           no
  IPFW support:                            no
  DAG enabled:                             no
  Napatech enabled:                        no
  Unix socket enabled:                     yes
  Detection enabled:                       yes

  libnss support:                          yes
  libnspr support:                         yes
  libjansson support:                      yes
  Prelude support:                         yes
  PCRE jit:                                yes
  LUA support:                             yes
  libluajit:                               yes
  libgeoip:                                no
  Non-bundled htp:                         yes
  Old barnyard2 support:                   no
  CUDA enabled:                            no

  Suricatasc install:                      yes

It has Luajit enabled, libjansson for the JSON output, NFQ and AF_PACKET IPS modes, NSS for MD5 checksums and unix sockets. Quite a good feature set.

Run

To get it running, we need a few more steps:

Edit /etc/default/suricata:

1. Change RUN=no to RUN=yes
2. Change LISTENMODE to “af-packet”:

Now lets start it.

# service suricata start
Starting suricata in IDS (af-packet) mode... done.

And confirm that it’s running.

# ps aux|grep suricata
root     20295  1.8  4.1 200212 42544 ?        Ssl  00:50   0:00 /usr/bin/suricata -c /etc/suricata/suricata-debian.yaml --pidfile /var/run/suricata.pid --af-packet -D

Check if we’re seeing traffic:

# tail /var/log/suricata/stats.log -f|grep capture
capture.kernel_packets    | RxAFPeth01                | 406
capture.kernel_drops      | RxAFPeth01                | 0
capture.kernel_packets    | RxAFPeth11                | 0
capture.kernel_drops      | RxAFPeth11                | 0
capture.kernel_packets    | RxAFPeth01                | 411
capture.kernel_drops      | RxAFPeth01                | 0
capture.kernel_packets    | RxAFPeth11                | 0
capture.kernel_drops      | RxAFPeth11                | 0
capture.kernel_packets    | RxAFPeth01                | 417
capture.kernel_drops      | RxAFPeth01                | 0
capture.kernel_packets    | RxAFPeth11                | 0
capture.kernel_drops      | RxAFPeth11                | 0
capture.kernel_packets    | RxAFPeth01                | 587
capture.kernel_drops      | RxAFPeth01                | 0
capture.kernel_packets    | RxAFPeth11                | 0
capture.kernel_drops      | RxAFPeth11                | 0
capture.kernel_packets    | RxAFPeth01                | 593
capture.kernel_drops      | RxAFPeth01                | 0
capture.kernel_packets    | RxAFPeth11                | 0
capture.kernel_drops      | RxAFPeth11                | 0

Logging

As the init script starts Suricata in daemon mode, we need to enable logging to file:

Edit /etc/suricata/suricata-debian.yaml and go to the “logging:” section, there change the “file” portion to look like:

  - file:
      enabled: yes
      filename: /var/log/suricata/suricata.log

Note: in the YAML indentation matters, so make sure it’s exactly right.

Rules

Oinkmaster is automatically installed, so lets use that:

First create the rules directory:

mkdir /etc/suricata/rules/

Open /etc/oinkmaster.conf in your editor and add:

url = https://rules.emergingthreats.net/open/suricata-2.0/emerging.rules.tar.gz

Then run:

# oinkmaster -C /etc/oinkmaster.conf -o /etc/suricata/rules
Loading /etc/oinkmaster.conf
Downloading file from https://rules.emergingthreats.net/open/suricata-2.0/emerging.rules.tar.gz... done.
...

Edit /etc/suricata/suricata-debian.yaml and change “default-rule-path” to:

default-rule-path: /etc/suricata/rules

Finally, restart to load the new rules:

# service suricata restart

Validate

Now that Suricata is running with rules, lets see if it works:

# wget http://www.testmyids.com
--2015-01-08 01:21:30--  http://www.testmyids.com/
Resolving www.testmyids.com (www.testmyids.com)... 82.165.177.154

This should trigger a specific rule:

# tail /var/log/suricata/fast.log 
01/08/2015-01:21:30.870346  [**] [1:2100498:7] GPL ATTACK_RESPONSE id check returned root [**] [Classification: Potentially Bad Traffic] [Priority: 2] {TCP} 82.165.177.154:80 -> 192.168.122.181:59190

Success! 🙂

Thanks

Thanks to Arturo Borrero Gonzalez for taking on this work for us. Also many thanks for Pierre Chifflier for maintaining the Suricata and libhtp packages in Debian.

Profiling Suricata with JEMALLOC

JEMALLOC is a memory allocation library: http://www.canonware.com/jemalloc/

It offers many interesting things for a tool like Suricata. Ken Steele of EZchip (formerly Tilera) made me aware of it. In Ken’s testing it helps performance.

Install

wget http://www.canonware.com/download/jemalloc/jemalloc-3.6.0.tar.bz2
tar xvfj jemalloc-3.6.0.tar.bz2
cd jemalloc-3.6.0
./configure --prefix=/opt/jemalloc/
make
sudo make install

Then use it by preloading it:

LD_PRELOAD=/opt/jemalloc/lib/libjemalloc.so ./src/suricata -c suricata.yaml -l tmp/ -r ~/sync/pcap/sandnet.pcap -S emerging-all.rules -v

I haven’t benchmarked this, but if you’re running a high performance setup it may certainly be worth a shot.

Profiling

The library comes with many interesting profiling and debugging features.

make clean
./configure --prefix=/opt/jemalloc-prof/ --enable-prof
make
sudo make install

Start Suricata like this:

LD_PRELOAD=/opt/jemalloc-prof/lib/libjemalloc.so ./src/suricata -c suricata.yaml -l tmp/ -r ~/sync/pcap/sandnet.pcap -S emerging-all.rules -v

Now we don’t see any change as we need to tell jemalloc what we want.

Exit stats

Dumps a lot of stats to the screen.

MALLOC_CONF=stats_print:true LD_PRELOAD=/opt/jemalloc-prof/lib/libjemalloc.so ./src/suricata -c suricata.yaml -l tmp/ -r ~/sync/pcap/sandnet.pcap -S emerging-all.rules -v

Memory leak checks

MALLOC_CONF=prof_leak:true,lg_prof_sample:0 LD_PRELOAD=/opt/jemalloc-prof/lib/libjemalloc.so ./src/suricata -c suricata.yaml -l tmp/ -r ~/sync/pcap/sandnet.pcap -S emerging-all.rules -v
[... suricata output ...]
<jemalloc>: Leak summary: 2011400 bytes, 4523 objects, 645 contexts
<jemalloc>: Run pprof on "jeprof.22760.0.f.heap" for leak detail

Then use the pprof tool that comes with jemalloc to inspect the dumped stats.

$ /opt/jemalloc-prof/bin/pprof --show_bytes ./src/suricata jeprof.22760.0.f.heap
Using local file ./src/suricata.
Using local file jeprof.22760.0.f.heap.
Welcome to pprof!  For help, type 'help'.
(pprof) top
Total: 2011400 B
1050112  52.2%  52.2%  1050112  52.2% PacketGetFromAlloc
600064  29.8%  82.0%   600064  29.8% SCProfilePacketStart
103936   5.2%  87.2%   103936   5.2% SCACCreateDeltaTable
65536   3.3%  90.5%    66192   3.3% pcap_fopen_offline
35520   1.8%  92.2%    35520   1.8% ConfNodeNew
26688   1.3%  93.6%    26688   1.3% __GI___strdup
20480   1.0%  94.6%    20480   1.0% MemBufferCreateNew
20480   1.0%  95.6%    20480   1.0% _TmSlotSetFuncAppend
14304   0.7%  96.3%    14304   0.7% pcre_compile2
14064   0.7%  97.0%    25736   1.3% SCPerfRegisterQualifiedCounter

So it seems we don’t properly clean up our packet pools yet.

Create a PDF of this info:

$ /opt/jemalloc-prof/bin/pprof --show_bytes --pdf ./src/suricata jeprof.22760.0.f.heap > jemalloc.pdf

Dumping stats during runtime

Dump stats after every 16MiB of allocations (lg_prof_interval:24, means every 2^24 bytes, so 16MiB)

I’ve done this in a separate directory since it dumps many files.

$ mkdir jemalloc-profile
$ cd jemalloc-profile/
$ MALLOC_CONF="prof:true,prof_prefix:victor.out,lg_prof_interval:24" LD_PRELOAD=/opt/jemalloc-prof/lib/libjemalloc.so ../src/suricata -c ../suricata.yaml -l ../tmp/ -r ~/sync/pcap/sandnet.pcap -S ../emerging-all.rules -v

Then you should see new *.heap files appear, many during startup. But after some time it should slow down.

You can then visualize the diff between two dumps:

$ /opt/jemalloc-prof/bin/pprof --show_bytes --pdf ../src/suricata --base victor.out.24159.150.i150.heap victor.out.24159.200.i200.heap > jemalloc.pdf

This creates a PDF of the 200th dump taking the 150th dump as a baseline. As we dump every ~16MiB, this covers about 50 * 16 = 800MiB worth of allocations.

Further reading

http://www.canonware.com/jemalloc/
https://github.com/jemalloc/jemalloc/wiki
https://github.com/jemalloc/jemalloc/wiki/Use-Case%3A-Heap-Profiling

Many thanks to Ken Steele for pointing me to the lib and providing me with some good examples.

Crossing the Streams in Suricata

At it’s core, Suricata is a packet processor. It reads packets and pushes them through a configurable pipeline. The 2nd most important processing unit in Suricata is the flow. In Suricata we use the term flow for the bidirectional flows of packets with the same 5 tuple (proto, src ip, dst ip, sp, dp. Vlans can be added as well). In fact, much of Suricata’s threading effort revolves around the flow. In the 2 main runmodes, autofp and workers, flow based load balancing makes sure that a all packets of a single flow always go through the same threading pipeline. In workers this means one single thread, in autofp 2: the capture thread and a stream/detect/output thread.

Flows are the central unit for out ‘app layer’ parsing. Protocol parsers like HTTP don’t even have access to the original packet. It all runs on top of the stream engine, which tracks TCP flows in … our flow structure.

Another place where the flow is crucial is in many of the rules. Rules extensively use the concept of ‘flowbits’. This allows one rule to ‘flag’ a flow, and then another to check this flag. In Emerging Threats many hundreds of rules use this logic.

Ever since we started Suricata, we’ve been talking about what some called ‘global flowbits’. A bit of a strange and contradictory name, but pretty much rule writers wanted the logic of flowbits, but then applied to other units as well. So a few weeks ago I (finally) decided to check if I could quickly implement ‘hostbits’. As Suricata already has a scalable ‘host table’, it was easy add the storage of ‘bits’ there. In a few hours I had the basics working and made it public: see this pull request.

Although I got some nice feedback, I was mostly interested in what the ET folks would think, since they would be the main consumers. While presenting the work I also mentioned the xbits ideas by Michael Rash and the response was “wow, do we have ip_pair tracking now?”. Ehh, no, just ip/host based… “Ah well, I guess that is nice too”. Not exactly the response I hoped for 🙂

IP pair tracking is not something Suricata already did. But as the need was clear I decided to have a look at it. Turned out it was quite simple to do. The IPPair tracker is much like the Host tracking. It’s only done on demand, which sets it apart from the Flow tracking which is done unconditionally. In this case only the new keyword is making use of the IP Pair storage.

So, what I have implemented is pretty much ‘xbits’. It supports tracking by ‘ip_src’, ‘ip_dst’ and ‘ip_pair’. It uses the syntax as suggested by Michael Rash:

xbits:<set|unset|isset|isnotset|toggle>,<bitname>,\
      track <ip_src|ip_dst|ip_pair>,expire <seconds>

It’s only lightly tested, so I would appreciate testing feedback!

You’ll find the code here in PR 1275 at github. This should normally end up in Suricata 2.1, which will come out early next year.

SMTP file extraction in Suricata

In 2.1beta2 the long awaited SMTP file extraction support for Suricata finally appeared. It has been a long development cycle. Originally started by BAE Systems, it was picked up by Tom Decanio of FireEye Forensics Group (formerly nPulse Technologies) followed by a last round of changes from my side. But it’s here now.

It contains:

  • a MIME decoder
  • updates to the SMTP parser to use the MIME decoder for extracting files
  • SMTP JSON log, integrated with EVE
  • SMTP message URL extraction and logging

As it uses the Suricata file handling API, it shares almost everything with the existing file handling for HTTP. The rule keyword work and the various logs work automatically with SMTP as well.

Trying it out

To enable the file extraction, make sure that the MIME decoder is enabled:

app-layer:
  protocols:
    smtp:
      enabled: yes
      # Configure SMTP-MIME Decoder
      mime:
        # Decode MIME messages from SMTP transactions
        # (may be resource intensive)
        # This field supercedes all others because it turns the entire
        # process on or off
        decode-mime: yes

        # Decode MIME entity bodies (ie. base64, quoted-printable, etc.)
        decode-base64: yes
        decode-quoted-printable: yes

        # Maximum bytes per header data value stored in the data structure
        # (default is 2000)
        header-value-depth: 2000

        # Extract URLs and save in state data structure
        extract-urls: yes

Like with HTTP, SMTP depends on the stream engine working correctly. So this page applies https://redmine.openinfosecfoundation.org/projects/suricata/wiki/File_Extraction, although of course the HTTP specific settings are irrelevant to SMTP.

Troubleshooting (SMTP) file extraction issues should always start here: https://redmine.openinfosecfoundation.org/projects/suricata/wiki/Self_Help_Diagrams#File-Extraction-and-Logging-Issues

Logging

Enabling the SMTP logging is simple, just add ‘smtp’ to the list of types in your EVE config, like so:

  # Extensible Event Format (nicknamed EVE) event log in JSON format
  - eve-log:
      enabled: yes
      filetype: regular #regular|syslog|unix_dgram|unix_stream
      filename: eve.json
      # the following are valid when type: syslog above
      #identity: "suricata"
      #facility: local5
      #level: Info ## possible levels: Emergency, Alert, Critical,
                   ## Error, Warning, Notice, Info, Debug
      types:
        - alert:
            # payload: yes           # enable dumping payload in Base64
            # payload-printable: yes # enable dumping payload in printable (lossy) format
            # packet: yes            # enable dumping of packet (without stream segments)
            # http: yes              # enable dumping of http fields
        - http:
            extended: yes     # enable this for extended logging information
            # custom allows additional http fields to be included in eve-log
            # the example below adds three additional fields when uncommented
            #custom: [Accept-Encoding, Accept-Language, Authorization]
        - dns
        - tls:
            extended: yes     # enable this for extended logging information
        - files:
            force-magic: no   # force logging magic on all logged files
            force-md5: no     # force logging of md5 checksums
        #- drop
        - smtp
        - ssh
        # bi-directional flows
        #- flow
        # uni-directional flows
        #- newflow

URLs

As a bonus, the MIME decoder also extracts URL’s from the SMTP message body (not attachments) and logs them in the SMTP log. This should make it easy to post process them. Currently only ‘HTTP’ URLS are extracted, starting with ‘http://‘. So HTTPS/FTP or URLs that don’t have the protocol prefix aren’t logged.

Testing

Naturally, if you’re using SMTP over TLS or have STARTTLS enabled, as you should at least on public networks, none of this will work.

Please help us test this feature!

Suricata Training Tour

After a lot of preparations, it’s finally going to happen: official Suricata trainings!

In the next couple of months I’ll be doing at least 3 sessions: a home match (Amsterdam), a workshop in Luxembourg and a session at DeepSec. Next to this, we’re planning various US based sessions on the East coast and West coast.

I’m really looking forward to doing these sessions. Other than the official content, there will be plenty of room for questions and discussions.

Hope to see you soon! 🙂

detecting: malloc(-1) or malloc(0xffffffff)

In Suricata we’re often not printing malloc errors. The reason is that we’re not willing to print such errors based on (attacker controlled) traffic. So often such cases are silently handled.

We came across a bug though, where a integer underflow led to -1/0xffffffff being passed to malloc. Luckily, malloc just failed by returning NULL, and this return was properly handled. Still, passing such a large value to malloc is a bug, so I would like to catch it.

This turned out to be trickier than I thought.

valgrind says: ==10274== Warning: silly arg (-1) to malloc(). However, it does not count it as an error. So calling valgrind with –error-exitcode=255 (my usual choice) doesn’t work.

glibc’s malloc responds to an environment variable, MALLOC_CHECK_ (I tried values 0 to 7), but this didn’t catch it at all.

AddressSanitizer also detects it as something non-fatal: ==18885== WARNING: AddressSanitizer failed to allocate 0xffffffffffffffff bytes. Not fatal like the usual errors, and no exit code.

tcmalloc, preloaded through LD_PRELOAD=/usr/lib/libtcmalloc_minimal.so.0, also just prints something to stderr: tcmalloc: large alloc 0 bytes == (nil) @

I also tried electric-fence, however this failed to work for me altogether.

As I wanted this check to be part of my QA, I needed an automated check. In this case however, I saw no other way than to just inspect the stderr output of one of the tools above. My choice was tcmalloc, as it’s fast and doesn’t require compile time options.

Suricata Flow Logging

Pretty much from the start of the project, Suricata has been able to track flows. In Suricata the term ‘flow’ means the bidirectional flow of packets with the same 5 tuple. Or 7 tuple when vlan tags are counted as well.

Such a flow is created when the first packet comes in and is stored in the flow hash. Each new packet does a hash look-up and attaches the flow to the packet. Through the packet’s flow reference we can access all that is stored in the flow: TCP session, flowbits, app layer state data, protocol info, etc.

When a flow hasn’t seen any packets in a while, a separate thread times it out. This ‘Flow Manager’ thread constantly walks the hash table and looks for flows that are timed out. The time a flow is considered ‘active’ depends on the protocol, it’s state and the configuration settings.

In Suricata 2.1, flows will optionally be logged when they time out. This logging is available through a new API, with an implementation for ‘Eve’ JSON output already developed. Actually, 2 implementations:

  1. flow — logs bidirectional records
  2. netflow — logs unidirectional records

As the flow logging had to be done at flow timeout, the Flow Manager had to drive it. Suricata 2.0 and earlier had a single Flow Manager thread. This was hard coded, and in some cases it was clearly a bottleneck. It wasn’t uncommon to see this thread using more CPU than the packet workers.

So adding more tasks to the Flow Manager, especially something as expensive as output, was likely going to make things worse. To address this, 2 things are now done:

  1. multiple flow manager support
  2. offloading of part of the flow managers tasks to a new class of management threads

The multiple flow managers simply divide up the hash table. Each thread manages it’s own part of it. The new class of threads is called ‘Flow Recycler’. It takes care of the actual flow cleanup and recycling. This means it’s taking over a part of the old Flow Manager’s tasks. In addition, if enabled, these threads are tasked with performing the actual flow logging.

As the flow logging follows the ‘eve’ format, passing it into Elasticsearch, Logstash and Kibana (ELK) is trivial. If you already run such a setup, the only thing that is need is enabling the feature in your suricata.yaml.

kibana-flow

kibana-netflowThe black netflow dashboard is available here: http://www.inliniac.net/files/NetFlow.json

Many thanks to the FireEye Forensics Group (formerly nPulse Technologies) for funding this work.

Detecting OpenSSL Heartbleed with Suricata

The OpenSSL heartbleed vulnerability is a pretty serious weakness in OpenSSL that can lead to information disclosure, in some cases even to to private key leaking. Please see this post here http://blog.existentialize.com/diagnosis-of-the-openssl-heartbleed-bug.html for more info.

This is a case where an IDS is able to detect the vuln, even though we’re talking about TLS.

LUA

I’ve written a quick and dirty LUA script to detect it:

alert tls any any -> any any ( \
    msg:"TLS HEARTBLEED malformed heartbeat record"; \
    flow:established,to_server; dsize:>7; \
    content:"|18 03|"; depth:2; lua:tls-heartbleed.lua; \
    classtype:misc-attack; sid:3000001; rev:1;)

The script:

function init (args)
    local needs = {}
    needs["payload"] = tostring(true)
    return needs
end

function match(args)
    local p = args['payload']
    if p == nil then
        --print ("no payload")
        return 0
    end
 
    if #p < 8 then
        --print ("payload too small")
    end
    if (p:byte(1) ~= 24) then
        --print ("not a heartbeat")
        return 0
    end
 
    -- message length
    len = 256 * p:byte(4) + p:byte(5)
    --print (len)
 
    -- heartbeat length
    hb_len = 256 * p:byte(7) + p:byte(8)

    -- 1+2+16
    if (1+2+16) >= len  then
        print ("invalid length heartbeat")
        return 1
    end

    -- 1 + 2 + payload + 16
    if (1 + 2 + hb_len + 16) > len then
        print ("heartbleed attack detected: " .. (1 + 2 + hb_len + 16) .. " > " .. len)
        return 1
    end
    --print ("no problems")
    return 0
end
return 0

Regular rules

Inspired by the FOX-IT rules from http://blog.fox-it.com/2014/04/08/openssl-heartbleed-bug-live-blog/, here are some non-LUA rules:

Detect a large response.

alert tls any any -> any any ( \
    msg:"TLS HEARTBLEED heartbeat suspiciuous large record"; \
    flow:established,to_client; dsize:>7; \
    content:"|18 03|"; depth:2; \
    byte_test:2,>,200,3,big; classtype:misc-attack; \
    sid:3000002; rev:1;)

Detect a large response following a large request (flow bit is either set by the LUA rule above or by the rule that follows):

alert tls any any -> any any ( \
    msg:"TLS HEARTBLEED heartbeat attack likely succesful"; \
    flowbits:isset,TLS.heartbleed; \
    flow:established,to_client; dsize:>7; \
    content:"|18 03|"; depth:2; byte_test:2,>,200,3,big; \
    classtype:misc-attack; \
    sid:3000003; rev:1;)

Detect a large request, set flowbit:

alert tls any any -> any any ( \
    msg:"TLS HEARTBLEED heartbeat suspiciuous large request"; \
    flow:established,to_server; content:"|18 03|"; depth:2; \
    content:"|01|"; distance:3; within:1; \
    byte_test:2,>,200,0,big,relative; \
    flowbits:set,TLS.heartbleed; \
    classtype:misc-attack; sid:3000004; rev:1;)

Suricata TLS parser

Pierre Chifflier has written detection logic for the Suricata TLS parser. This is in our git master and will be part of 2.0.1. If you run this code, enable these rules:

alert tls any any -> any any ( \
    msg:"SURICATA TLS overflow heartbeat encountered, possible exploit attempt (heartbleed)"; \
    flow:established; app-layer-event:tls.overflow_heartbeat_message; \
    flowint:tls.anomaly.count,+,1; classtype:protocol-command-decode; \
    reference:cve,2014-0160; sid:2230012; rev:1;)
alert tls any any -> any any ( \
    msg:"SURICATA TLS invalid heartbeat encountered, possible exploit attempt (heartbleed)"; \
    flow:established; app-layer-event:tls.invalid_heartbeat_message; \
    flowint:tls.anomaly.count,+,1; classtype:protocol-command-decode; \
    reference:cve,2014-0160; sid:2230013; rev:1;)

Ticket: https://redmine.openinfosecfoundation.org/issues/1173
Pull Request: https://github.com/inliniac/suricata/pull/924

Other Resources

– My fellow country (wo)men of Fox-IT have Snort rules here: http://blog.fox-it.com/2014/04/08/openssl-heartbleed-bug-live-blog/ These rules detect suspiciously large heartbeat response sizes
– Oisf-users has a thread: https://lists.openinfosecfoundation.org/pipermail/oisf-users/2014-April/003603.html
– Emerging Threats has a thread: https://lists.emergingthreats.net/pipermail/emerging-sigs/2014-April/024049.html
– Sourcefire has made rules available as well http://vrt-blog.snort.org/2014/04/heartbleed-memory-disclosure-upgrade.html These should work on Suricata as well.

Update 1:
– Pierre Chifflier correctly noted that hb_len doesn’t contain the ‘type’ and ‘size’ fields (3 bytes total), while ‘len’ does. So updated the check.
Update 2:
– Yonathan Klijnsma pointed me at the difference between the request and the response: https://twitter.com/ydklijnsma/status/453514484074962944. I’ve updated the rule to only inspect the script against requests.
Update 3:
– Better rule formatting
– Add non-LUA rules as well
Update 4:
– ET is going to add these rules: https://lists.emergingthreats.net/pipermail/emerging-sigs/2014-April/024056.html
Update 5:
– Updated the LUA script after feedback from Ivan Ristic. The padding issue was ignored.
Update 6:
– Added Pierre Chifflier’s work on detecting this in the Suricata TLS parser.
– Added reference to Sourcefire VRT rules

Suricata 2.0 and beyond

Today I finally released Suricata 2.0. The 2.0 branch opened in December 2012. In the little over a year that it’s development lasted, we have closed 183 tickets. We made 1174 commits, with the following stats:

582 files changed, 94782 insertions(+), 63243 deletions(-)

So, a significant update! In total, 17 different people made commits. I’m really happy with how much code and features were contributed. When starting Suricata this was what I really hoped for, and it seems to be working!

Eve

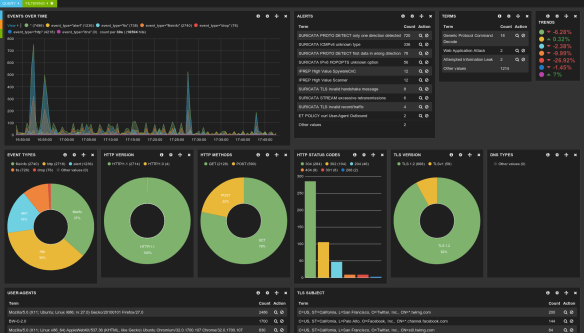
The feature I’m most excited about is ‘Eve’. It’s the nickname of a new logging output module ‘Extendible Event Format’. It’s an all JSON event stream that is very easy to parse using 3rd party tools. The heavy lifting has been done by Tom Decanio. Combined with Logstash, Elasticsearch and Kibana, this allows for really easy graphical dashboard creation. This is a nice addition to the existing tools which are generally more alert centered.

kibana300 kibana300map kibana-suri

Splunk support is easy as well, as Eric Leblond has shown:

regit-Screenshot-from-2014-03-05-231712

Looking forward

While doing releases is important and somewhat nice too, the developer in me is always glad when they are over. Leading up to a release there is a slow down of development, when most time is spent on fixing release critical bugs and doing some polishing. This slow down is a necessary evil, but I’m glad when we can start merging bigger changes again.

In the short term, I shooting for a fairly quick 2.0.1 release. There are some known issues that will be addressed in that.

More interestingly from a development perspective is the opening of the 2.1 branch. I’ll likely open that in a few weeks. There are a number of features in progress for 2.1. I’m working on speeding up pcap recording, which is currently quite inefficient. More interestingly, Lua output scripting. A preview of this work is available here  with some example scripts here.

Others are working on nice things as well: improving protocol support for detection and logging, nflog and netmap support, taxii/stix integration, extending our TLS support and more.

I’m hoping the 2.1 cycle will be shorter than the last, but we’ll see how it goes 🙂